Profit and Loss Statement
All of the money that your business earned from when it started minus the expenses that it incurred will be the total profit (or loss) the business has generated. But we aren’t interested in the total amount, but the amount that is generated last month or last quarter or last year. Hence, Profit and Loss statement is always viewed for a specific time period.
Here are some insights you can gain from this report:
- Compare this month’s profit with last month.
- Compare quarter wise or year wise profits or losses.
- Find out the total profit or loss for a specific time window.
The P&L statement for any period reflects all the income minus all the expenses in that period. At the end of the period, (a fiscal year) the total profit (or loss) goes into Owner’s Equity because the profit in the business belongs to the owners. The owner’s account is a liability to the company since the company has to pay out the profits/losses.
To check your P&L statement, navigate to it using the sidebar: Reports > Profit And Loss
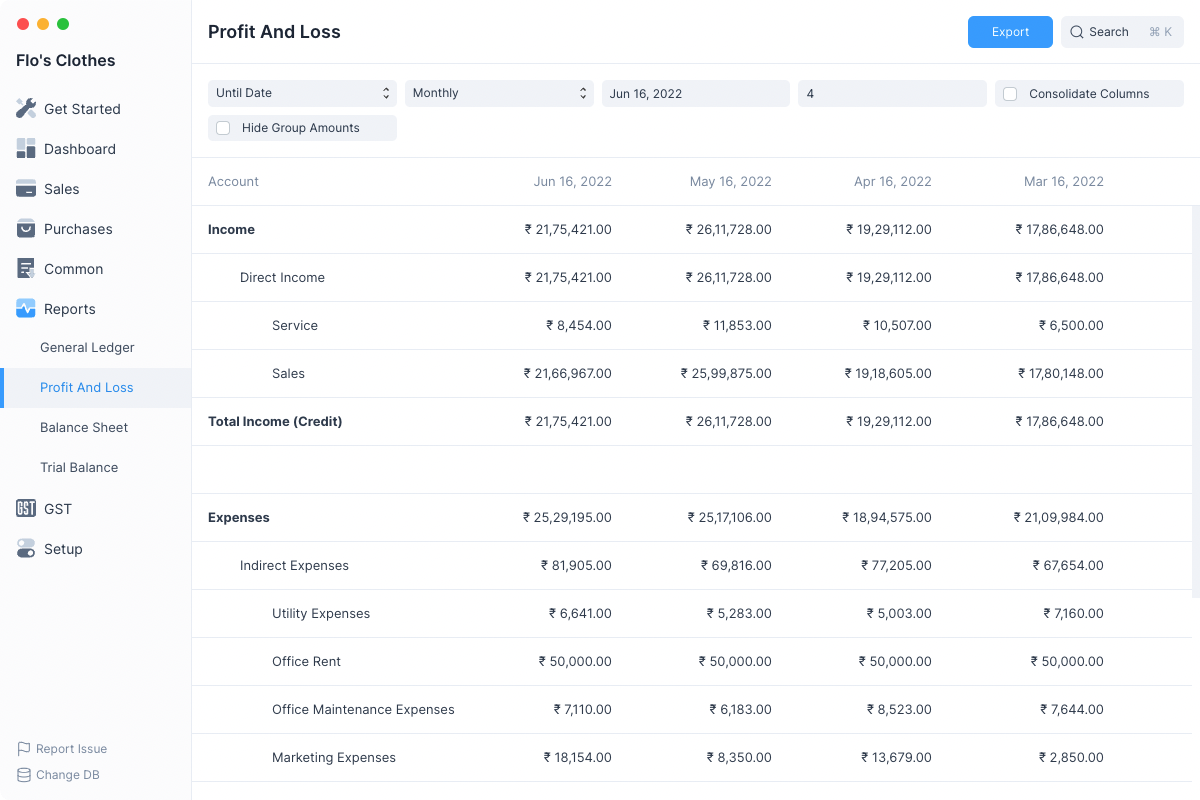
By default the Profit and Loss report will show P&L values for the last 3 months.
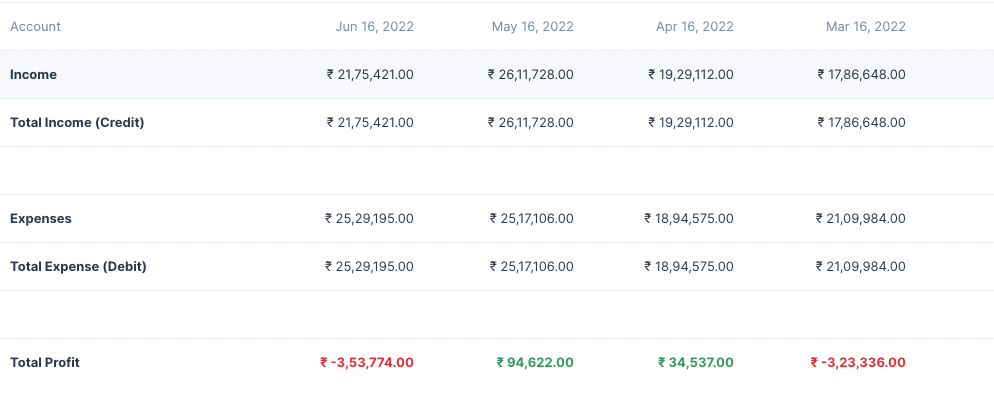
As you can clearly see, we have the total Income in the first part which also shows the income coming from each Income account split Monthly so you have a better understanding of your income. The same is done with the Expense section. The report is concluded by the total profit (or loss) incurred which is also split Monthly.
Filters
The Profit and Loss report has several filters which can help you narrow the date range between which to display the report.
Based On
This allows for toggling betwee the kind of filters used set the date range. It has 2 values:
- Until Date
- Fiscal Year
Periodicity
This selects the interval for which the Profit and Loss has to be calculated.
Example setting this to Monthly will display columns on a monthly basis.
Date Range Filters
These filters depend on the value of Based On
| Based On | Date Range Filters |
|---|---|
| Until Date | To Date and Count |
| Fiscal Year | To Year and From Year |
To Date and Count
To Date is the final date until which the report is to be displayed, by default the values is tomorrow's date.
Count depends on Periodicity so if Count is 3 and Periodicity is Monthly then the report will display Profit and Loss columns for the last three months starting from To Date
To Year and From Year
These decide the fiscal year between which the Profit and Loss report has to be displayed. The number of columns will depend on the Periodicity.
Consolidate Columns
Checking this this will sum up all the values for each row and display a single column.
Hide Group Amounts
The Profit and Loss report format displays the group accounts such as Direct Income along with the non group accounts such as Sales and Services.
Group account balances depend on the non group account balances under them, group account balances are not directly updated.
So clicking on Hide Group Amounts will display only the non group account amounts making the report a bit easier to read.
Folding Rows
Rows in the Profit and Loss report which display group accounts can be clicked to fold all the rows underneath them.